Simplify memory profiling of your Ruby app!
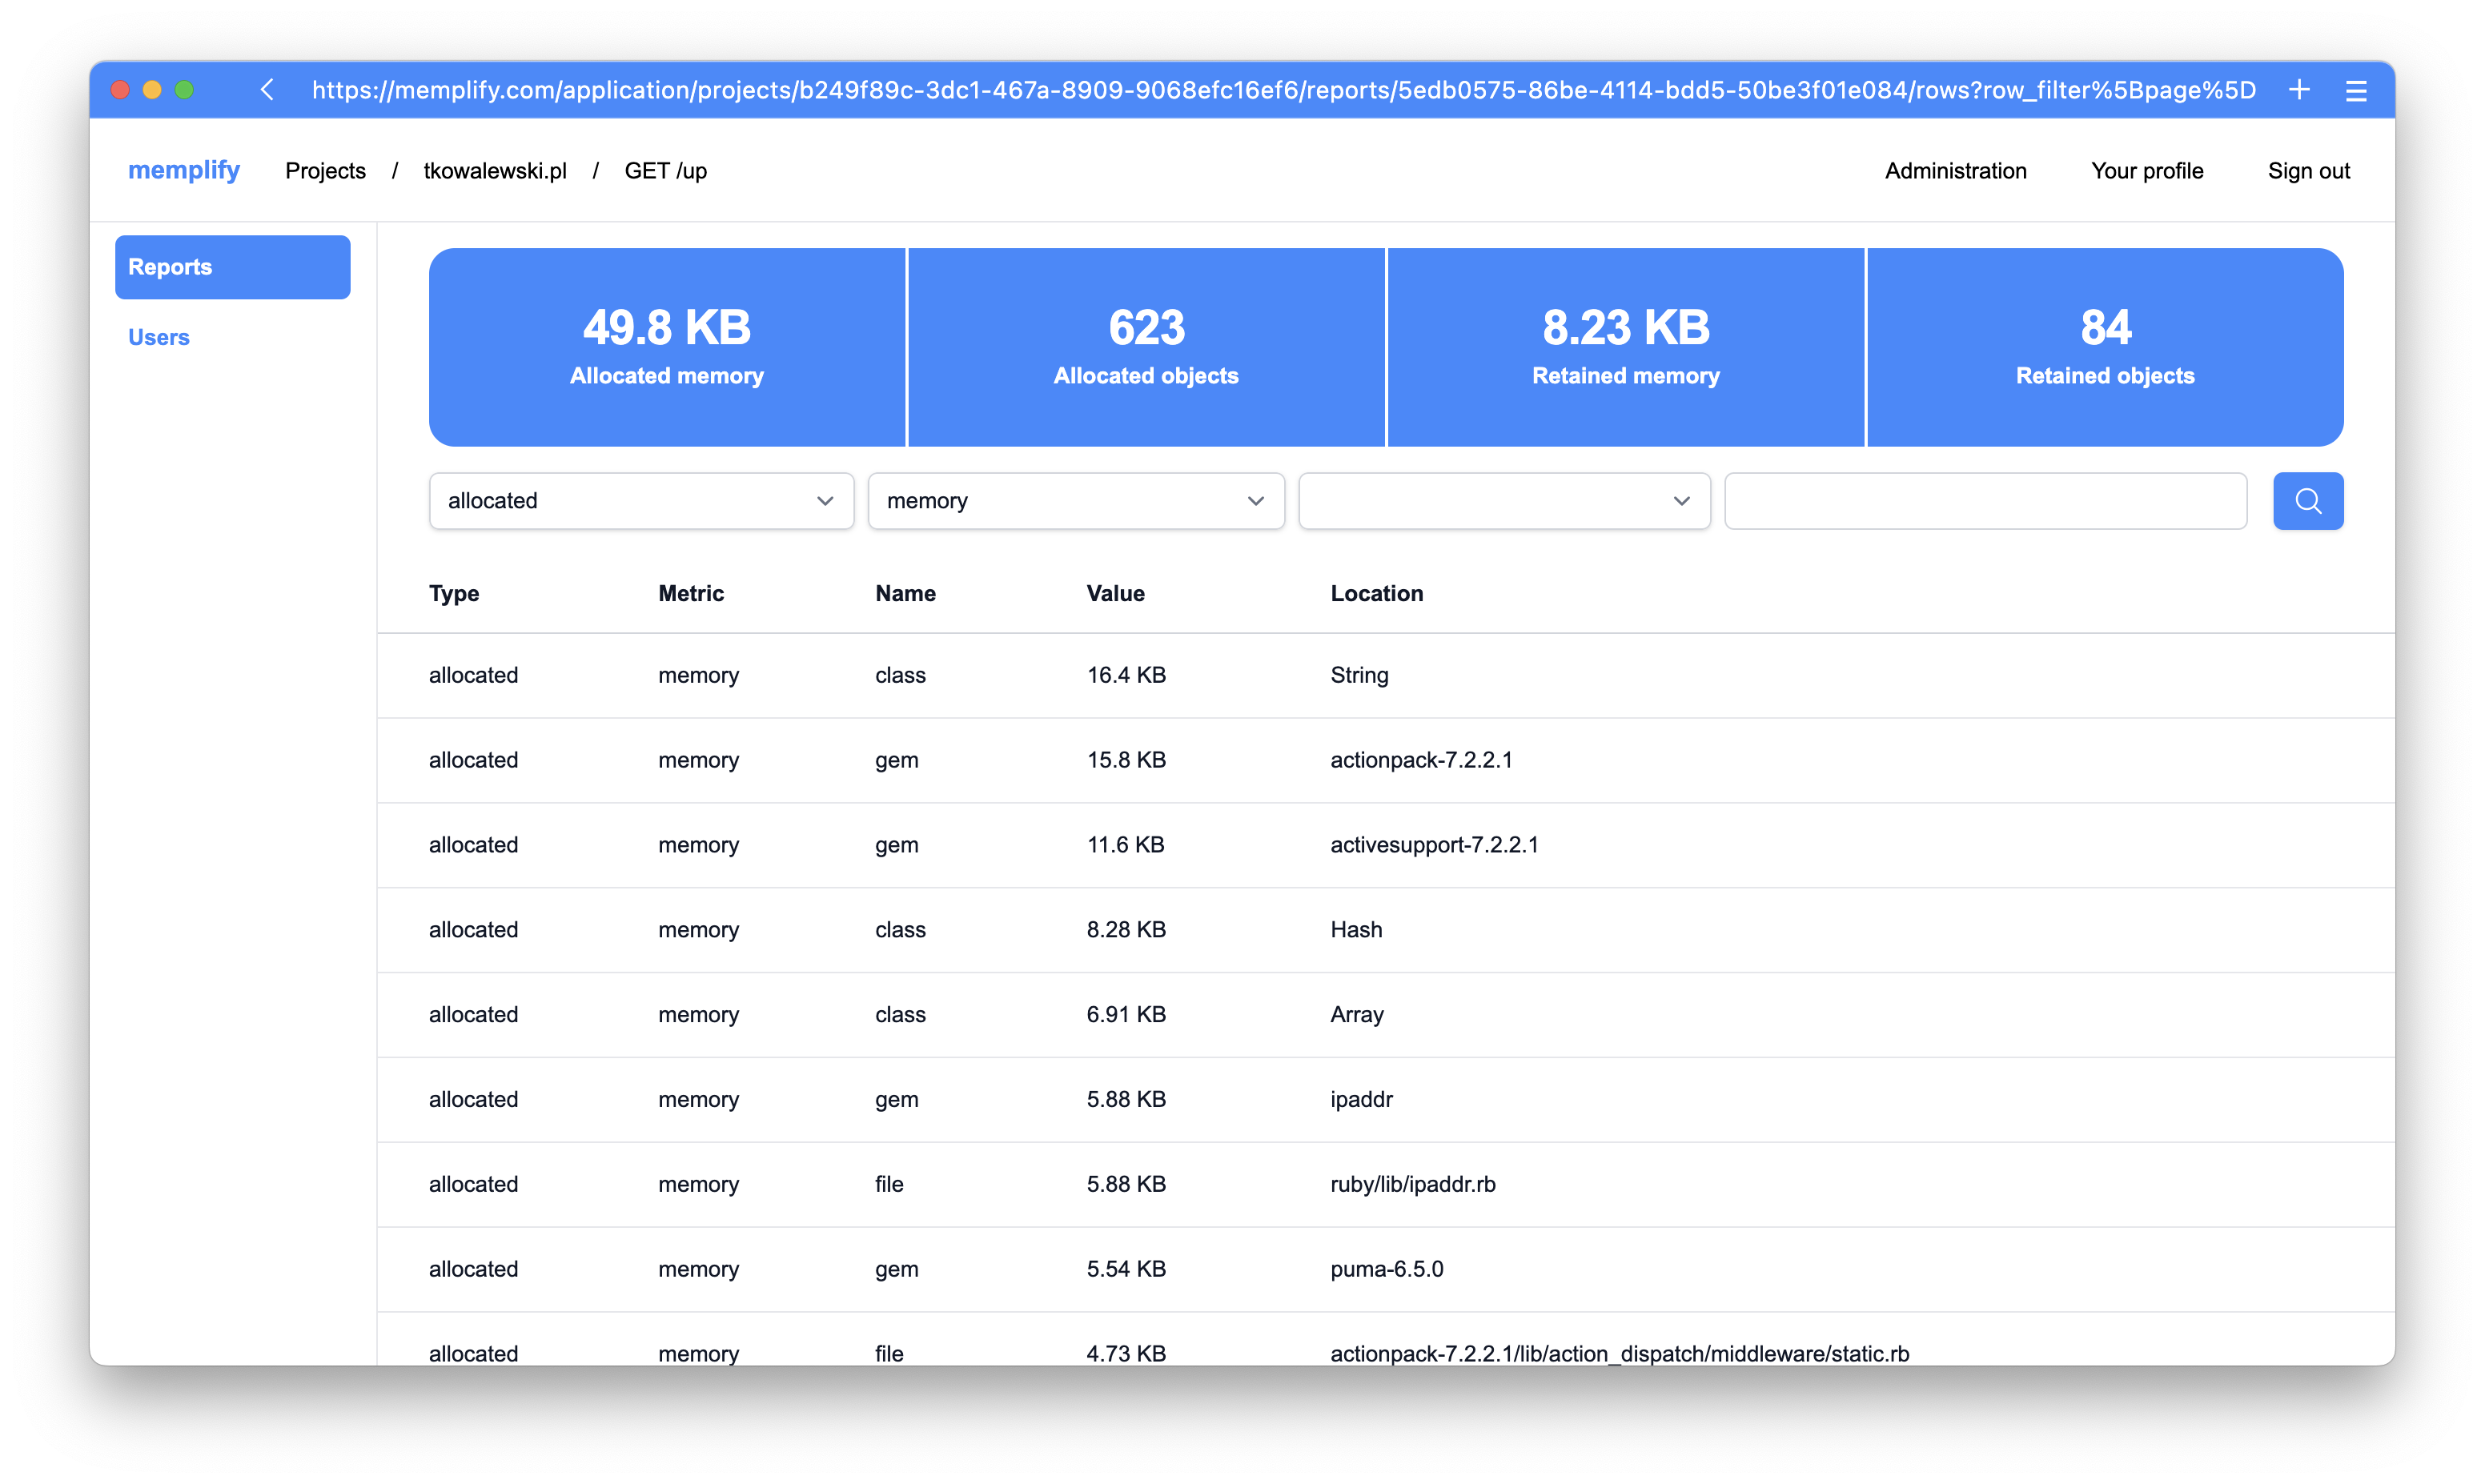
Is your application struggling with memory issues? Discover our profiling interface that helps you identify bottlenecks and excessive memory usage. Gain full control over your application's performance and make data-driven decisions to enhance quality, stability, and speed.
HOWTO
Problem with installation or usage? Join our Discord
- Installation
-
Add memplify gem to Gemfile
gem "memplify"
Install gem
bundle install
- Rails applications
-
Create initializer for memplify
# config/initializers/memplify.rb
require "memplify"

Memplify.configure do |configuration|
  configuration.access_token = "[ACCESS_TOKEN]"
end
-
Add memplify middleware for staging environment
# config/environments/staging.rb
Rails.application.configure do
  config.middleware.insert(0, Memplify::Middleware)
end
- Rack applications
-
# config.ru require "memplify" Memplify.configure do |configuration| configuration.access_token = "[ACCESS_TOKEN]" end class Application def call(env) status = 200 headers = { "content-type" => "text/html" } body = ["Kaboom!"] [status, headers, body] end end builder = Rack::Builder.new do use Memplify::Middleware if ENV["RACK_ENV"] == "staging" map('/') { run Application.new } end run builder - Other applications / services
-
You can use memplify also in background jobs and in any place of your application by using reporter directly
Memplify.report("custom/profile", profile: ENV["ENVIRONMENT"] == "staging") do
  # Your code
end